Tool to determine supply chain biodiversity impact
Client
![]()
For Platform BEE, PRé, Arcadis and CODE developed BioScope, a tool to easily determine the impact of a company’s supply chain on biodiversity, visualised on a world map. The data can be gathered and entered by non-experts, a great advantage.
About
Companies are increasingly aware that their businesses are highly dependent on natural capital. This is already obvious for the agri-food business, but the trend is also rising in more industrial sectors. However, companies find it difficult to get a good understanding of the biodiversity impact arising from their operations, especially their supply chain: there are many schemes you could follow, and the outputs tend to be too high level, without many leads for practical improvement, or too detailed, requiring long studies, cumbersome data collection, and expert staff.
This was the also the opinion of Platform BEE (biodiversity, ecosystems and economics, a joint initiative from the Confederation of Netherlands Industry and Employers (VNO-NCW) and the Dutch national committee of the International Union for Conservation of Nature (IUCN NL), financed by the Dutch Ministry of Economic Affairs. Platform BEE commissioned PRé, together with consultancy bureau Arcadis and web development bureau CODE, to design and develop a tool to enable companies to get an impression of the biodiversity impacts of their operations and supply chain.
Challenge
Platform BEE had quite a clear idea of what a tool should provide to users: a simple interface, with simple data entry, which would give an idea of a biodiversity impact in a company’s supply chain on a map. Arcadis and PRé drafted a rough roadmap to expand on these requirements. We then did several interviews with interested companies from the Natural Captains network to define the detailed list of requirements.
Solution
The need that emerged led us to a very specific technical solution:
- A web-based interface, hosted on a dedicated web domain
- Data covering the whole supply chain
- Accessible for non-experts
- Regionalized data, so the provenance can be tracked
- Scientifically sound calculations and assumptions
- Results that are easy to understand for non-experts
PRé converted these requirements into specifications, and CODE developed the website and the interface.
BioScope
We quickly decided that the Exiobase 2.2 database was indispensable for the tool. It covers data for 48 countries and regions for the rest of the world. To be able to use it, companies only need to know how much they spent on their most important commodities, and where the suppliers are located. The tool then calculates the results in the background, using online SimaPro capabilities with the ReCiPe method. The ReCiPe method allows the tool to provide comparable scores for the various impact drivers.
BioScope was developed as a free-access web tool. It has a simple user interface where companies can enter simple data that are easy to come by: how much did they spend per important commodity, and where are the suppliers? Because we use a database listing all the economic flows between trade sectors and between countries, the result is an overview of the activities in the supply chain that are likely to cause the biggest impacts on biodiversity, and where in the world they happen.
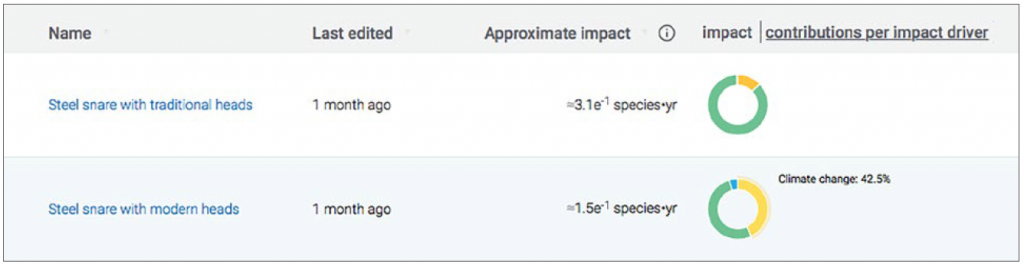
Thanks to the lightweight design of the interface, users can easily generate alternative scenarios, compare them and check the main contributors.
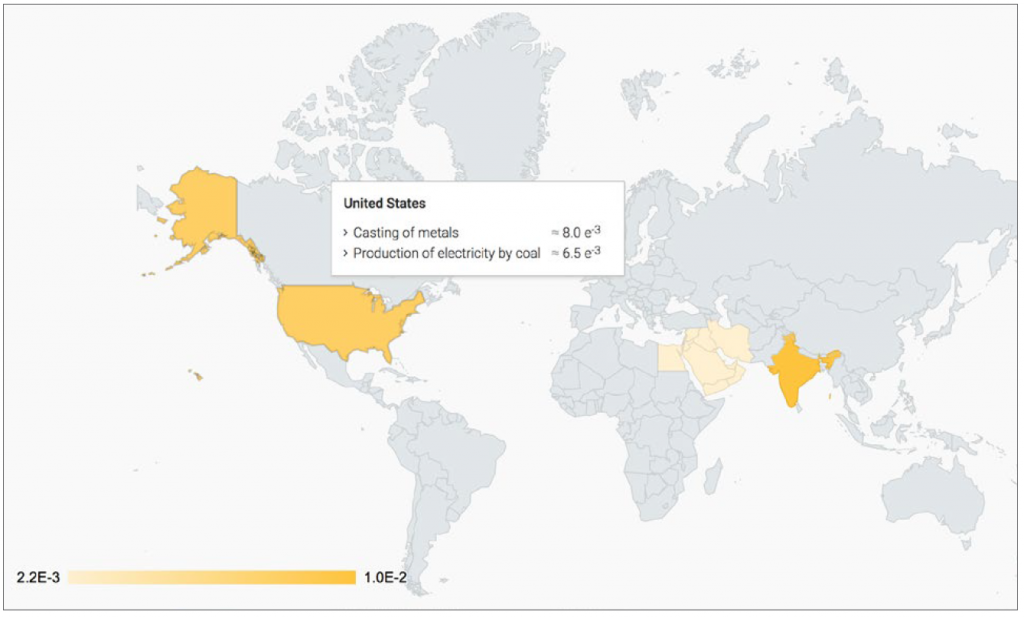
The most interesting feature of BioScope is the possibility to instantly display the results on a world map, showing where the biodiversity impact may happen and which human activity is the most likely to cause it.
Benefits
The main advantages of the tool include:
- Simple visualization of the company’s supply chain and impact on biodiversity.
- Instant information about which commodities are relevant for improvement programs, and where they originate on a world map.
- Different strategies that can be assessed immediately, thanks to the copy and compare functions.
- Easy-to-find tool with a simple URL, that is free to use and accessible to any company – the data required do not have to be collected by experts.
The BioScope tool is retired as of September 1, 2025 and is no longer available. Still, our work in biodiversity continues: with organizations seeking to understand their impacts, with the advancement of impact assessment methodologies, and with professionals through capacity building.
Ready to step up to the next great sustainability challenge?
Learn more about how our team can support you with biodiversity assessment of products, organizations or investments.
Contact the expert
Jori Coustillas
Sector Lead Engineering & Tech