Data dive: Network science meets life cycle assessment
To truly be able to offer fact-based analyses, it’s good for life cycle assessment (LCA) practitioners to keep an open mind for analysis methods from other fields. One interesting discipline we could learn from is network science. This article covers the basics of network analysis and shares some tantalizing applications for sustainability.
Making sense of complex data with network science
Network science or network analysis is the analysis of a system of interconnected components. The components can be anything: train networks, social relations on Facebook, or flows of products in the economy and the environment. The applications of network science are equally diverse: it is used in logistics problems , for analyzing complex protein interaction patterns to aid cancer research, and in the life-or-death battle against misinformation about epidemics.
Like LCA, network science needs metrics that help us to understand the behavior and structure of the network. For instance, a researcher might want to know how a disease is spreading in the population. Maybe she would start by looking at the number of infections, the frequency of infections, or the age of the patients with the disease.
This may be useful for determining if the disease is generally getting more prevalent. But this is approach may not offer much actionable information to halt the spread of the disease. To take action, you need to trace the paths the disease travels to spread within the network. For instance, are there social groups or locations, through which it is more likely that the disease will be transmitted?
If we simply look at statistics of a population, we may fail to miss important correlations between the individual members. But these relationships are the exact thing that make these systems interesting, or in this case, dangerous. This example illustrates that, to make sense of highly interconnected systems, it is the interconnections that say the most. The same is true for the socio-economic systems that life cycle assessment (LCA) examines. In this article, we’ll take a quick look at how network science works and how we can look at datasets from a network perspective. But first we need to know the lingo.
Network science terminology
In network science, we represent each component (e.g. a social media account) as a point or “node” on a graph, and we refer to the connections between them as “edges”.
But just mapping nodes and edges doesn’t yet make sense of a system. For that we need network metrics, like “betweenness” centrality (and others with equally brilliant names). The centrality of a component in the system quantifies how much the other nodes in the network depend on it, and betweenness is a way of calculating the centrality. I’ll use these terms in an example below, before applying it to life cycle assessment.
Everything’s connected – an example of centrality
Imagine two countries, with electricity grids containing power stations and distribution hubs. The two countries rely heavily on each other to match demand under different weather conditions – one has a large amount of solar and wind farms, while the other is stronger in hydroelectric power generation. The countries agreed to build two transmission lines connecting them, with a capacity of 0.5 GW, and later of 5 GW. Over the course of a year, large amounts of electricity are transmitted along both connections.
Let’s plot a network diagram, showing the centralities through the sizes of the components of this network.
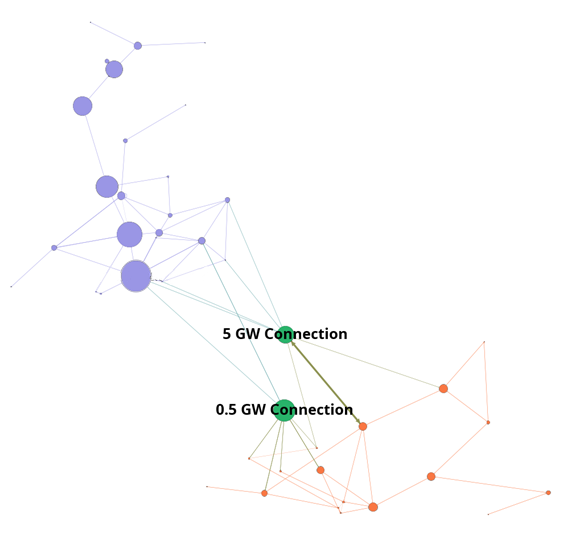
As you can see in the diagram above, the distribution hubs have large centralities because, if these were impaired, electricity would have to travel through a much longer path, or even not be able to flow from one end of the electricity network to the other. The green border interconnections also have high centralities because they have a large capacity to transmit electricity and they are points of connection between large networks of interdependent nodes. When the sun doesn’t shine and the wind doesn’t blow … you see the value of friendly neighborhood relations.
In summary, the greater the number of other nodes that a flow (e.g. electricity or information) would have to pass through if a given node were removed from the network, the greater the betweenness centrality of that node is to network.
Applying network analysis to LCA
While it may seem fairly obvious that a major power connection can be a critical component, not all networks give obvious results.
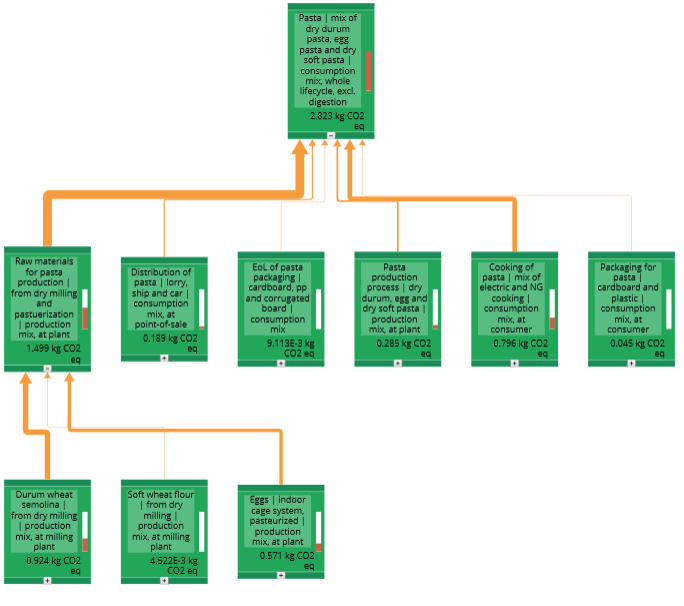
When doing life cycle assessments, Sankey diagrams (like the one from SimaPro’s online platform below) are great example of how highly complex webs, including those involved in manufacturing, can be visualized to highlight processes responsible for large environmental impacts. Fighting the climate emergency or environmental impacts in general is easier when we are provided with pictures that highlight root causes.
Applying network science to life cycle inventories (LCI)
It is also possible to apply network analysis to the life cycle inventories themselves. Substances that tend to be modelled as being used or emitted together form patterns that can be used to check data quality or inform users of relevant models.
Below, you can see a network representation of the ecoinvent v3.7 database, showing how human activities and products link to each other. Each circle represents a flow of a manmade substance in various colors (e.g. electricity, in yellow), and the human activities (e.g. electricity generation) that produce them. When a process uses a given flow, a line is drawn between the two. Colors are assigned to flows based on the type of product (e.g. Pulp, paper and paperboard-processes are one color, metal products another). The size of the circle is proportional to the number of processes that use it.
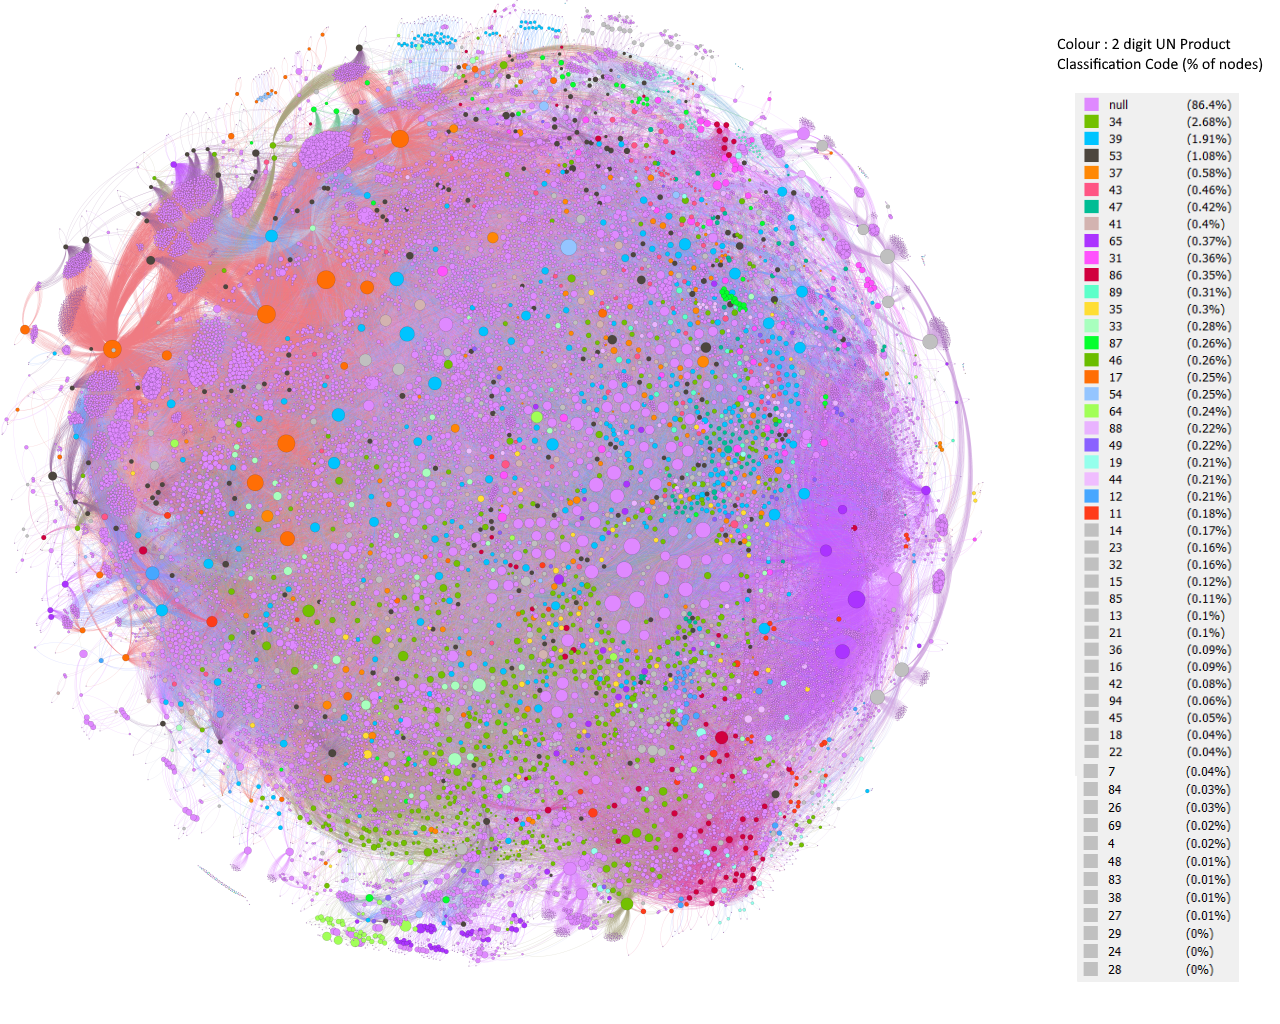
In the dataset plotted, the two most commonly used intermediate exchanges are “heat, for reuse in municipal waste recycling”, and “electricity, for reuse in municipal waste recycling”. Seeing data and models in different perspectives can make patterns readable that a table or a bar chart simply cannot show. That is the beauty of network science.
When would you use network science?
Of course, we can’t just apply network analysis on its own. Network analysis can’t determine how statistically significant your result is, for example. For that, you still need Monte Carlo analysis and good sampling practices. If you have a very simple LCI dataset, bad labeling, or a dataset with large data gaps, other forms of data analysis and a better form of data collection are more important.
But if you’re working with highly interconnected systems, network analysis is a good tool to have in your toolbox. It can help to untangle complex webs and chains of causality, reveal communities and help make data beautifully tangible through network visualizations. Returning to our scientist fighting a disease: in the past few months, network science has made a very tangible difference to people’s lives. It has in fact helped inform decision makers when to tighten, or loosen, restrictions on social interaction and combat the spread of coronavirus .
Even if you aren’t fighting the next big crisis, exploring life cycle data more deeply and beautifully with network science is a good way to find new insights in your work – and besides, it’ll be far from boring.
Artur Donaldson
LCA Data Scientist
I have always had a passion for the natural environment and found an interest in complex systems while studying Physics at university. I believe it is important to make human impacts on the natural world tangible and scientifically robust. We need to act now to thrive within planetary and social boundaries in the future. I feel lucky to be a part of this effort, by making tools to help.