LCA of frozen food products versus their alternatives
Client
![]()
When it comes to the carbon footprint of food products, the preservation method may end up mattering a lot. Keeping food frozen takes electricity. Fresh foods are more perishable. And jarred and canned foods have their own costs and benefits associated with them. But how do we know which method has the lowest carbon footprint for which type of food? For a large frozen food company, PRé compared 22 frozen food products with the same food product preserved with an alternative method.
About
Nomad Foods is Europe’s leading frozen food company. The company’s portfolio of iconic brands, which includes Birds Eye, Findus, iglo, Ledo and Frikom, have been a part of consumers’ meals for generations, standing for great tasting food that is convenient, high quality and nutritious. Nomad Foods is headquartered in the United Kingdom.
Nomad Foods has been calculating its corporate carbon footprint since 2015, and are actively working to reduce the impact of the company and its product portfolio on the environment.
Challenge
Nomad Foods approached PRé with two challenges.
Challenge 1: Calculating carbon footprints and identifying hotspots
Nomad Foods is setting company-wide carbon footprint reduction targets. That means they need to understand the environmental impact of their products to know where to target changes most effectively. Product carbon footprinting is an effective next step to gain insights of the product value chains with a higher granularity.
The first aim of the study was therefore to calculate the carbon footprint of some of Nomad Foods’ main products and identify hotspots along the value chain.
Challenge 2: Determining the trade-offs between preservation methods
As a frozen food company, Nomad Foods recognized that there are potential trade-offs between a frozen food supply chain and one using alternative preservation methods. The drawback of the frozen supply chain is the energy required for both the initial freezing and ongoing frozen storage. The potential benefits lie in food preservation; frozen food is not very perishable, which may mean that more food can be consumed by humans (as intended) rather than downgraded to animal feed, or to waste.
The second aim of the study was to determine if there are significant differences in the carbon footprint between frozen and non-frozen food products. This should lead to a better understanding of the environmental trade-offs between different preservation methods.
Solution
To address both challenges, PRé conducted an LCA study that compared the environmental impact of 22 leading Nomad Foods products (all frozen foods) to equivalent products using alternative preservation methods: fresh, chilled, homemade, jarred or canned, depending on the product. The products selected are from the categories fish, plant-based proteins (from the “Green Cuisine” range) and vegetables.
The scope of the study is cradle to grave, meaning it includes all life cycle stages: from the farming and wild capture of raw ingredients to the consumed product, including end of life of the package and any non-consumed food product. Each product was assessed for sale and consumption in one specific country.
To assess how the frozen foods compare to those with alternative preservation methods, fictional alternative products were created (i.e. the comparison was not made with existing products). We chose this approach to ensure that the differences in environmental impact were specifically caused by the difference in preservation method. Because of this different preservation method, the products would then have differences in: manufacturing processes, temperature of transport vehicles, storage temperatures and technologies, packaging, and food loss and waste rates throughout the value chain. We kept everything else the same: the ingredient composition, manufacturing efficiencies, ingredient and product distribution routes, and location of consumption.
The carbon footprint was the focus of this study. However, other environmental impacts from the EF 3.0 impact assessment method were calculated to identify potential trade-offs in the comparison.
The study was reviewed by an independent review panel to conform to ISO 14040/44: 2006, so the results and insights are approved for sharing externally.
Where are the impact hotspots?
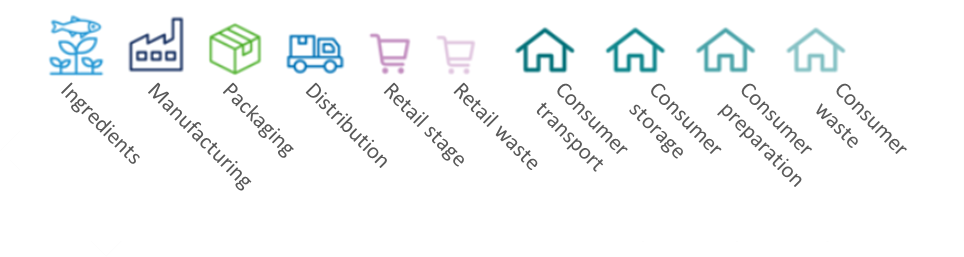
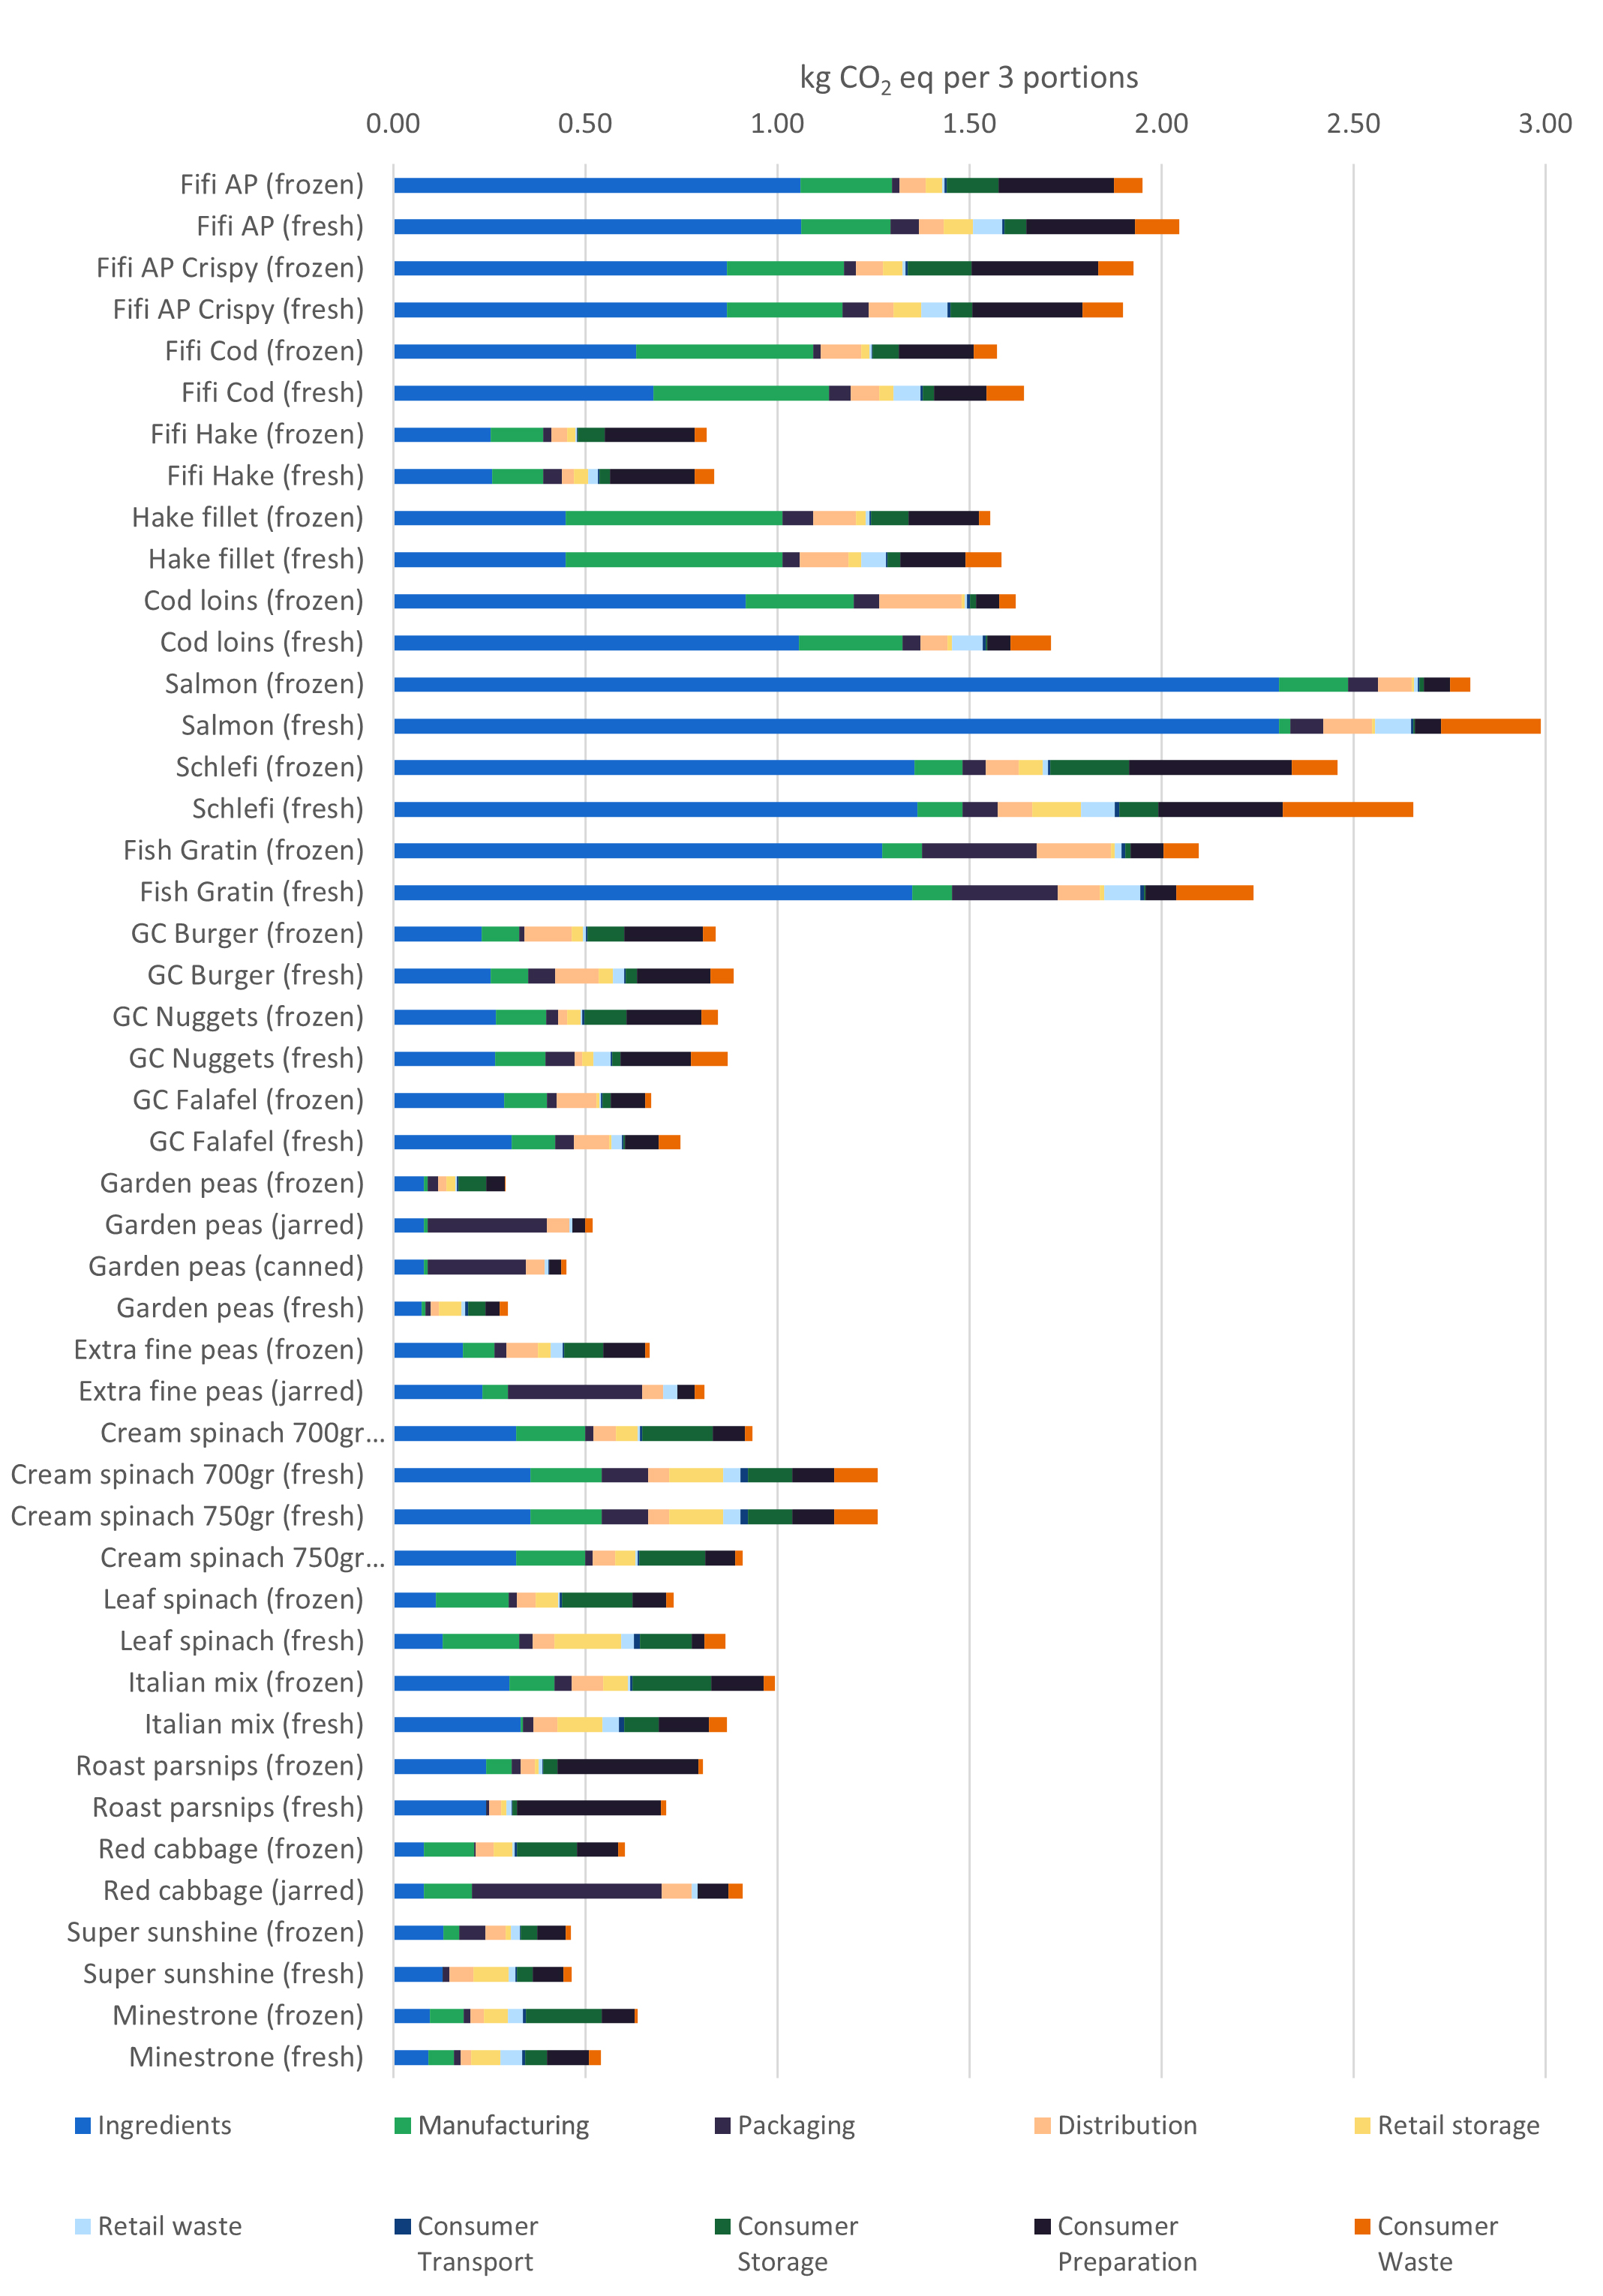
The relative contribution of life cycle stages to the carbon footprint varies slightly for different products and product types, and between the frozen product and its alternative. The visual below shows an overview of the hotspots per product.
Ingredient production
In most cases, the ingredient production stage (which is the same for the frozen product and its alternative) contributes most to the overall carbon footprint of the product. For wild-caught fish, the fuel usage drives the impact, while for farmed fish the production of fish feed is the main contributor. For plant-based products, the drivers vary between products: common sources are fuel use during planting and harvesting, land-use change, herbicide and pesticide production, and irrigation efforts.
Manufacturing
The relative contribution of manufacturing varies between the products. For the plant-based Green Cuisine products, the contribution of manufacturing is significant. For the pure vegetable products, it is not. The fish products lie somewhere in the middle. The share of renewable electricity used by the factory has a large influence.
Packaging
For jarred and canned products, packaging has a significant impact on the carbon footprint. For the other products under study, the contribution of packaging is fairly low. The frozen products, in particular, are mainly packaged in a cardboard or thin plastic film, with a relatively low impact.
Distribution
For all products under study, distribution from the factory to the distribution centers has a minimal contribution.
Storage
Storage at retail and the consumer contributes significantly to the carbon footprint of most products under study, except for those stored at ambient temperatures, such as jars and cans. The share of renewables in the electricity mix determines the extent of the impact.
Food loss and waste
Retail and consumer food loss and waste contribute significantly to the carbon footprint, most notably the consumer food losses for fresh alternatives. Crucially, most of the impact caused by food loss and waste results from the wasted production resources required to compensate for the losses, rather than the waste treatment of the loss.
Consumer preparation
For many products in this study (for both frozen and the alternatives), consumer preparation, such as baking in the oven, contributes to the overall carbon footprint. However, in some cases it is still a relatively low share.
How do frozen foods compare to alternative preservation methods?
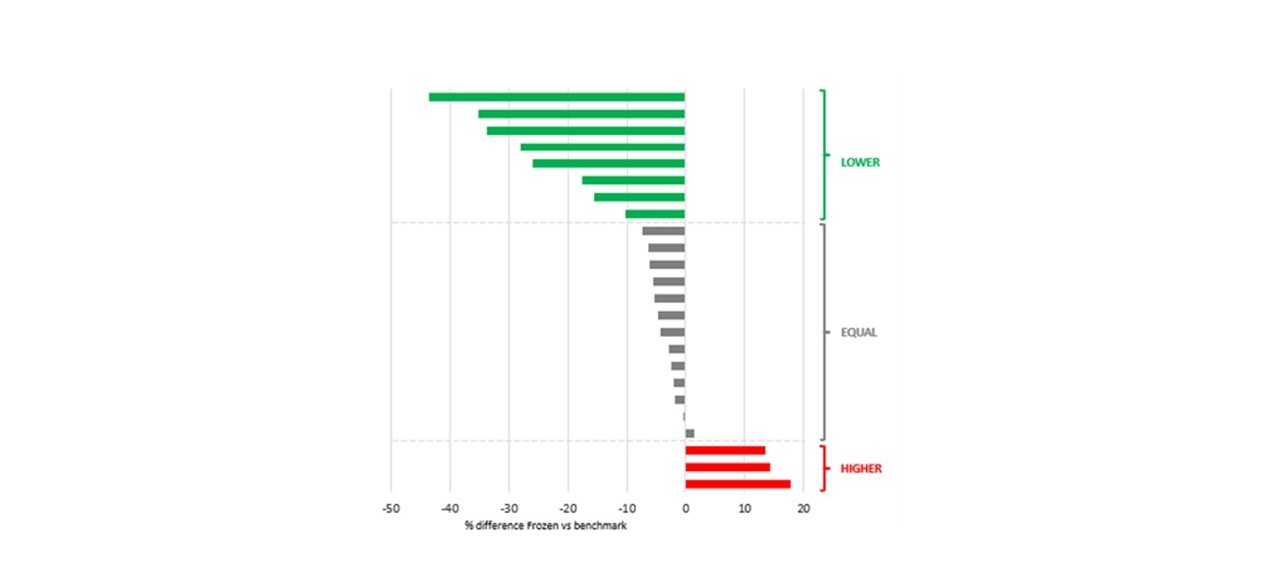
The visual below shows the numerical carbon footprint of the Nomad Foods frozen products under study, compared to the alternative product or products.
When looking purely at the numerical values, there are four products where the carbon footprint of the frozen product is higher than for the alternative product (ranging from 1% for the battered Alaska Pollock fish fingers to 17.8% for the Minestrone mix). For the remaining 18 products, the frozen product has a lower carbon footprint than the alternative (ranging from 0.4% for the super sunshine mix to 44% for jarred garden peas).
What determines the carbon footprint differences?
If we assume the carbon footprint of the production phase to be identical for the frozen products and their alternatives, four main factors determine the difference in carbon footprint. These factors may not contribute a lot to the total footprint, though; just to the difference.
When the frozen goods are compared to the alternatives:
- An electricity mix with a lower carbon footprint per kWh, used by retail and or consumers, is beneficial for frozen products.
- The shorter the consumer keeps the product in their freezer, the more beneficial for frozen products.
- If the food loss and waste (at retail and the consumer) of the alternative product is higher than that of the frozen product, for instance because fresh foods are more perishable, the frozen product is more likely to have a favorable footprint.
- If the relative contribution of the production stage (i.e. the cultivation of the ingredients and manufacturing of the product) is high, the environmental cost of producing additional ingredients to compensate the loss is relatively high. As a result, the impact associated with food loss and waste will be even higher, skewing the footprint in favor of frozen products.
Benefits
Overall, this study shows that when it comes to carbon footprint, there is no general advantage or disadvantage to using frozen food products compared to products using alternative preservation methods. However, it does support the idea that the lower food loss and waste rates of frozen products may compensate for the additional energy use caused by a frozen supply chain.
Nomad Foods’ LCA study is an important step forward in the company’s efforts to reduce its environmental impact. The study provided valuable insights into the environmental performance of Nomad Foods’ products and highlights areas where the company can improve. The findings will allow Nomad Foods to make informed decisions about how to develop a comprehensive sustainability strategy that addresses the most significant environmental issues.

Throughout the entire process, PRé demonstrated subject-matter expertise and the ability to apply this to a highly scientific analysis. The team were also able to connect us with industry-leading peer reviewers and flexible enough in their approach to accommodate many stakeholders in our fast-moving business environment. The result was the delivery of a high quality report, enabling us to not only compare our products versus other preservation methods, but to also identify where carbon reduction improvements can be made in our own supply chain. We’ve also been able to use the research as a hook to engage with key trade groups, regulators and other political stakeholders (both at EU and UK level) about adopting cradle-to-grave LCA methodology ahead of any forthcoming eco-labelling legislation.
Oliver Spring, Group Sustainability Manager at Nomad Foods
Would you like to have a look at the LCA study carried out? Check the summary report or read the full third party technical report below:
Contact the expert
Ellie Williams
Sector Lead Food & Beverage