Online tool for calculating GHG emissions in the Dutch dairy sector
Client s
![]()
![]()
For Zuivel NL and FrieslandCampina, PRé and software company VAA created a climate add-on to the mandatory KringloopWijzer indicator, allowing over 16,000 dairy farmers to independently calculate their GHG emissions.
About
The dairy sector in the Netherlands is an important player in the global dairy market, and animal farming is an activity where a significant amount of greenhouse gases are emitted. Both the dairy farmers and their customers are interested in knowing just how well their farms perform when it comes to GHG emissions.
The sector has the ambition to reduce its greenhouse gas (GHG) emissions by 20% in 2020 and to achieve climate-neutral growth . Additionally, an increasing number of dairy processors in the industry are distinguishing themselves through sustainability and would like insight into the carbon footprints of their supplying farmers. To meet both objectives, Dutch dairy farmers want to measure their GHG emissions in a robust and quantitative way.
Challenge
All farmers in the Netherlands are already required by law to complete the Annual Nutrient Cycle Assessment (Dutch: KringloopWijzer calculation module), developed by Wageningen University. The KringloopWijzer is an online tool that was built and paid for by the Dutch dairy sector, to facilitate compliance with the sustainable agenda of the Dutch government. Adding a climate module to this existing KringloopWijzer is an excellent way to provide farmers with insight from a robust LCA model without requiring much extra effort from farmers or compromising on ease of use.
Dairy trade organization Zuivel NL approached PRé to integrate GHG calculations into the online KringloopWijzer tool, based on a state-of-the art LCA standards. Thereby making environmental impact data and benchmarks available on sector and farmer level to stimulate more sustainable practices and reduction of the GHG emissions. The tool would potentially have to do more than 16,000 calculations per year.
Solution
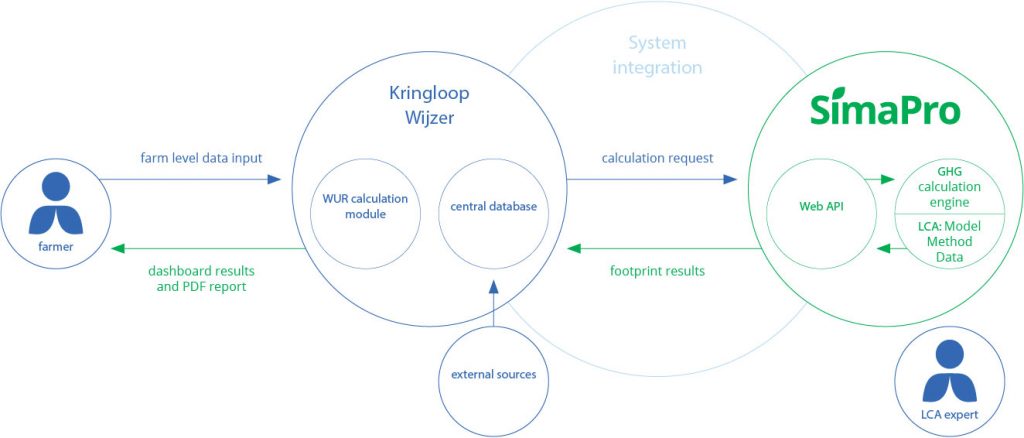
PRé developed an integrated solution that enriches the sector-specific online KringloopWijzer tool, consisting of the Central Database and the methodological calculation module KringloopWijzer- with environmental data extensions to measure in a qualitative, robust way, the GHG-emissions of each farm and of the sector as a whole.
The new GHG module uses a robust and highly parameterized LCA model, created by experts at dairy cooperative FrieslandCampina. The KringloopWijzer interface and Central Database, developed by software firm VAA, communicate directly with the SimaPro LCA model through an API. This essentially offers a real-time LCA calculation service, the engine behind the new GHG module.
With the GHG module and the SimaPro API, we developed a solution that meets the following customer criteria:
- Smooth integration of the online KringloopWijzer tool with the LCA software and a highly complex, sector-specific LCA model.
- High user-friendliness and accessibility for dairy farmers through an online, single-point-of-contact solution.
- Open, expert LCA model for seamless import of data and export of results.
- High level of flexibility to adapt and update the LCA model, method and LCI data, while ensuring the robustness and soundness of the model and the LCIA results.
- Sufficient speed and capacity to manage between 12,000 and 36,000 LCA calculations per month with a calculation time of no more than seconds.
- For stakeholders at the farm level, online insight into their carbon footprint and the underpinning factors contributing to their carbon footprint score.
Benefits
The solution is unique as it combines expert knowledge with easy data input and results visualization. This integrated solution has several benefits.
- Insight into the influence of farm activities on global warming
The tool gives farmers insight into how much GHG is emitted when they produce 1 kg of milk and how much of these GHG emissions are related to:
- Enteric methane emissions of the milk herd
- Greenhouse gas emissions from manure storage
- Emissions related to the production of purchased goods
- Emission from roughage cultivation on the farm
- Accessible sector benchmarking
The tool also allows farmers to easily view their company’s GHG emissions in comparison with similar dairy farms.
- User independence through online user interface
Farmers can independently conduct their own robust carbon footprint calculations by using the one-portal online tool to enter their data and to access a dashboard with their carbon footprint and sector benchmark scores. The tool’s design makes it easy to keep the methods, data and LCA model up to date with state-of-the-art knowledge. The combination of expert knowledge and easy data input enables the farmers to take ownership and action to effectively reduce their carbon footprint.
- Evidence-based results at a large scale
The tool makes environmental impact results and benchmarks visually available at an unprecedented scale, with the ability to manage up to 36,000 requests per month. This level of scalability enables the calculation of sector benchmarks and the individual carbon footprints of all farmers in the Dutch dairy sector, which stimulates more sustainable practices and GHG emission reduction in the dairy sector.
This integrated solution facilitates compliance and stimulates sustainable practices at a large scale, increasing the positive impact of a whole sector. It could be an inspiring example for other sectors as well.
Contact the expert
Caspar Honée
Sustainability Solutions Architect